
- Home
- PAR Brink Analytics and Report ...
PAR Brink Analytics and Reporting for Enterprise Restaurants
For Restaurants
Multi-location operators are rarely short on data. They are short on decisions. Every transaction, item, daypart, and location in your system generates numbers, and PAR’s enterprise reporting is one of the platform’s recent innovation areas, but numbers only matter when someone t
- Certified PAR and Brink POS Partner
- Custom PAR Brink POS Solutions & Ongoing Support
- Proven Restaurant Growth Strategies
- Dedicated Support Team
★★★★★
Trusted by 300+ restaurant owners
Multi-location operators are rarely short on data. They are short on decisions. Every transaction, item, daypart, and location in your system generates numbers, and PAR’s enterprise reporting is one of the platform’s recent innovation areas, but numbers only matter when someone t
- Certified PAR and Brink POS Partner
- Custom PAR Brink POS Solutions & Ongoing Support
- Proven Restaurant Growth Strategies
- Dedicated Support Team
Trusted by 300+ restaurant owners
Partners With The Tools You Already Use


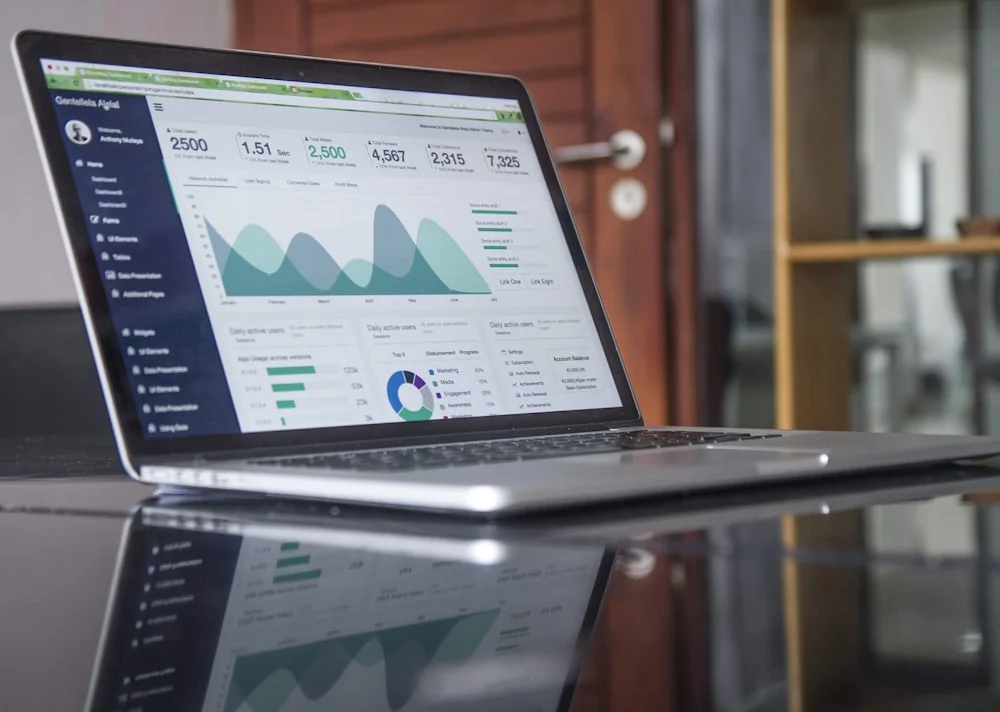
See the Whole System at a Glance
Twin stores get compared so outliers explain themselves.
Lunch, dinner, and weekend patterns surface per market.
Each owner sees their numbers in brand standard format.
Dashboards update on a cadence your team can trust.
Know What Every Item Earns
Items classified by popularity and margin, chain wide.
Every item gets a verdict, promote, reprice, rework, or cut.
Offers are measured for added traffic versus substitution.
Small per item wins multiply across every location.

Marketing That Answers for Revenue
Spend connects to ordering behavior, channel by channel.
Google Analytics joins the funnel to the sales picture.
REST and SOAP APIs link 250 to 300 plus partners.
Allocation decisions rest on measured returns, not habit.

Analysts Who Know the Platform
A Certified PAR and Brink POS Partner builds your layer.
Quarterly reviews frame findings as choices to make.
Methods built for chains, not single store reports.
POS, web, ads, and loyalty data live in one picture.

See the Whole System at a Glance
Twin stores get compared so outliers explain themselves.
Lunch, dinner, and weekend patterns surface per market.
Each owner sees their numbers in brand standard format.
Dashboards update on a cadence your team can trust.

Know What Every Item Earns
Items classified by popularity and margin, chain wide.
Every item gets a verdict, promote, reprice, rework, or cut.
Offers are measured for added traffic versus substitution.
Small per item wins multiply across every location.

Marketing That Answers for Revenue
Spend connects to ordering behavior, channel by channel.
Google Analytics joins the funnel to the sales picture.
REST and SOAP APIs link 250 to 300 plus partners.
Allocation decisions rest on measured returns, not habit.

Analysts Who Know the Platform
A Certified PAR and Brink POS Partner builds your layer.
Quarterly reviews frame findings as choices to make.
Methods built for chains, not single store reports.
POS, web, ads, and loyalty data live in one picture.

- TRUSTED BY RESTAURANT OWNERS
Real Results. Real Relationships.
More than marketing. More than technology. A true restaurant growth partner.
HetalDirty Dough Cookies
DineshCurry Pizza House
SmithWayback Burgers
LarryHard Rock CafeEverything You Need for PAR Brink POS — One Partner, Start to Finish
Clear deliverables. Tailored to what you actually need.
Getting your PAR Brink POS presence built right from day one.
Get a Quote- Cross-location dashboards, comparing sales, product mix, and daypart performance across every store, updated on a schedule
- Menu engineering analysis, classifying items by popularity and margin so promote, reprice, rework, or cut decisions get made
- LTO and promotion readouts, measuring what an offer added, what it cannibalized, and whether it deserves a repeat
Turning PAR Brink POS data into more orders and repeat customers.
Get a Quote- Marketing attribution, connecting campaigns and channels to ordering behavior so spend answers for results
- Google Analytics integration, joining website and ordering funnel behavior to the sales picture
- Franchisee scorecards, giving each owner their numbers in brand-standard format with corporate context
Keeping everything running and improving month over month.
Get a Quote- Outlier detection routines, surfacing stores and items drifting from their baselines before quarter end
- Quarterly decision reviews, where we walk leadership through findings framed as choices, not charts
For multi-location brands and restaurants with custom goals, scale, and integrations.
Contact Us- Custom strategy across locations
- Dedicated senior strategist
- Custom integrations & reporting
Every PAR Brink POS Service Under One Roof
Certified PAR Brink POS partners and POS experts handling hardware, setup, API based custom development, marketing and everything in between.
Multi-location operators are rarely short on data. They are short on decisions. Every transaction, item, daypart, and location in your system generates numbers, and PAR's enterprise reporting is one of the platform's recent innovation areas, but numbers only matter when someone turns them into action. PAR Brink analytics reporting is Mindshare Consulting's service for doing exactly that. As a Certified PAR and Brink POS Partner, we build cross-location dashboards your executives actually open, run menu engineering that tells you what to promote, fix, or cut, connect marketing attribution so campaigns answer for revenue, and integrate Google Analytics so digital behavior and sales live in one picture. PAR Brink analytics reporting turns the data your chain already produces into the decisions it has been postponing.
Data Rich and Decision Poor
The typical franchise group reviews sales weekly, glances at product mix occasionally, and decides menu changes by instinct and anecdote. Meanwhile the questions that move margin sit unanswered. Which items earn their menu space and which quietly lose money? Why does one store outperform its twin two miles away? Did the last LTO actually build traffic, or did it cannibalize full-price sales? What did the spring ad campaign return?
These questions are answerable with data the system already collects. What is missing is the layer between raw reports and executive decisions, someone to define the metrics that matter, assemble them across locations, and frame them as choices. Off-the-shelf reports also stop at the restaurant's edge. Your website analytics, ad platforms, and loyalty data hold the other half of the story, and until POS and digital data are joined, attribution stays guesswork.
Our PAR Brink Analytics Reporting Service
We build and operate your reporting layer as an ongoing service. It includes:
- Cross-location dashboards, comparing sales, product mix, and daypart performance across every store, updated on a schedule
- Menu engineering analysis, classifying items by popularity and margin so promote, reprice, rework, or cut decisions get made
- LTO and promotion readouts, measuring what an offer added, what it cannibalized, and whether it deserves a repeat
- Marketing attribution, connecting campaigns and channels to ordering behavior so spend answers for results
- Google Analytics integration, joining website and ordering funnel behavior to the sales picture
- Franchisee scorecards, giving each owner their numbers in brand-standard format with corporate context
- Outlier detection routines, surfacing stores and items drifting from their baselines before quarter end
- Quarterly decision reviews, where we walk leadership through findings framed as choices, not charts
Enterprise Reporting Is Native to the Platform
This service stands on a platform designed for it. PAR Technology acquired Brink Software in 2014 and built a unified ecosystem covering POS, online ordering, Punchh loyalty, kitchen display, and back-office operations, with enterprise reporting among its recent innovations. Its API-first approach, with 250 to 300+ integration partners across REST and SOAP APIs, is what allows POS data to meet Google Analytics, ad platforms, and accounting tools in one reporting layer. The platform runs at genuine scale, including Papa Johns across more than 3,200 US locations, and its capabilities are outlined on PAR Technology's website. Our role is the analysis and judgment layered on top, which no platform ships in a box.
Your data already knows the answers. Feed it well with disciplined PAR Brink POS management, grow the digital signals with PAR Brink online ordering, act on findings through PAR Brink restaurant advertising and PAR Brink email marketing, and extend the stack with PAR Brink API integration. Mindshare Consulting is the restaurant POS marketing agency that turns numbers into moves. Book an analytics working session.
Let's Build Your PAR Brink POS Analytics Plan
PAR Brink analytics reporting for multi location groups. Cross location dashboards, menu engineering, attribution and Google Analytics from a certified partner.
Free Strategy Session
Custom Growth Plan
Competitor Analysis
Revenue-Focused Recommendations
Frequently Asked Questions
The platform includes enterprise reporting across sales and operations, one of PAR's recent innovation areas. Our service builds on it, adding cross-location dashboards, menu engineering, attribution, and the analysis that turns reports into decisions.
Yes. Cross-location visibility is the core deliverable. Executives see the whole system with store-versus-store comparison, while district and franchisee views show each audience exactly their slice in a consistent format.
Menu engineering classifies every item by popularity and margin, then prescribes action, promote the stars, reprice or rework the underperformers, cut the dead weight. Run across a chain, small per-item improvements multiply into serious margin.
Google Analytics captures how guests behave on your website and ordering funnel. Joined with POS data, it shows the full path from visit to order to repeat, which is the picture attribution and budget decisions actually require.
Yes. We compare offer-window performance against baseline product mix to separate genuinely added traffic from substitution. It is one of the most valuable analyses we run, because it changes whether an offer gets repeated.
Dashboards refresh on an agreed schedule, scorecards typically go out weekly or monthly by audience, and leadership gets a quarterly decision review. The cadence is designed around your operating rhythm, not the other way around.
Brink's cloud back office provides real-time data per store, and enterprise reporting has been a recent PAR investment area, but multi-unit operators still report wanting better cross-location tooling. The data is all accessible through the platform and its APIs. Mindshare builds consolidated dashboards that compare sales, product mix, and daypart performance across every store, plus franchisee scorecards in a brand-standard format.
Reviewers do cite a lack of flexibility in stock reporting, especially for custom analysis. The practical answer is pulling data out through Brink's REST and SOAP APIs into your own reporting layer, where you control the metrics and format. Mindshare builds exactly that pipeline, joining POS sales data with Google Analytics, loyalty activity, and marketing data so decisions come from one trustworthy picture.

Meet Jay Mehta
Founder & Growth Partner, Mindshare Consulting Inc.
For more than 20 years, Jay has helped businesses grow through marketing, technology, automation, and customer acquisition. Today, he leads Mindshare Consulting as your dedicated growth partner, helping restaurants attract more customers, increase repeat visits, and generate more revenue.
Our focus isn’t marketing metrics. It’s helping restaurants attract more guests, increase online orders, grow catering sales, and maximize revenue.