

Restaurant Industry Statistics and Trends for 2026 (and What They Actually Mean for Your Marketing)
Sales are projected to hit $1.55 trillion this year, AI adoption just passed a quarter of all operators, and off-premise orders now make up nearly three out of every four transactions. Here’s what the real 2026 restaurant industry statistics say, and the specific marketing moves each one points to.
Most “industry statistics” roundups stop at the number. A restaurant owner reads that off-premise orders are up, nods, and closes the tab with nothing to actually do differently on Monday morning. At Mindshare Consulting Inc, we spend our days turning exactly this kind of data into local SEO plans, ad budgets, and website changes for restaurant clients, so this roundup pairs each verified statistic with the marketing decision it should be driving.
Restaurant Sales and Economic Trends
The National Restaurant Association’s 2026 State of the Restaurant Industry report projects total restaurant and foodservice sales will reach $1.55 trillion in 2026, with real sales growth forecast at a modest 1.3%. That headline number hides a much tighter margin story underneath it: 68% of operators said tariffs drove higher food or beverage costs in 2025, and 60% reported softer customer traffic over the same period.
| Metric | 2026 Figure | What It Means for Marketing |
|---|---|---|
| Projected industry sales | $1.55 trillion | Growth is real but slower, so winning share from competitors matters more than riding a rising tide |
| Real sales growth forecast | 1.3% | Flat-to-modest growth means marketing has to protect existing guest frequency, not just chase new traffic |
| Operators citing tariff-driven cost increases | 68% | Menu price increases need a value story attached, or guests notice the price and not the reason |
| Operators reporting softer 2025 traffic | 60% | Frequency-driving tactics (loyalty, retargeting, local search) matter more than one-time promotions |
The practical read: 2026 is not a year where marketing can coast on category growth. A restaurant that isn’t actively working local search rankings, review volume, and guest retention is handing that flat 1.3% growth straight to whichever competitor is doing those things.
Restaurant Labor and Staffing Trends
Average hourly restaurant wages climbed from $13.36 in April 2020 to $19.93 by December 2025, based on Bureau of Labor Statistics wage data compiled by Restaurant Dive. Quits in the restaurants and accommodations sector still hit 503,000 in a single month (July 2026), and the National Restaurant Association estimates the industry needs more than 200,000 additional workers just to return to pre-pandemic staffing levels.
Staffing statistics rarely make it into a restaurant’s marketing plan, but they should. A restaurant that can’t keep a dining room fully staffed on a Friday night doesn’t just lose that night’s covers, it loses the guests who tried to book, got turned away, and quietly stopped trying. Employer-branding content (a simple “why work here” page, real employee photos instead of stock images, a Google Business Profile that shows a well-run kitchen) is now a recruiting tool as much as a customer-facing one, and it costs a fraction of what a staffing agency charges per placement.
Restaurant Technology and AI Adoption
AI adoption in restaurants crossed a real threshold in 2026. The National Restaurant Association’s own report found 26% of operators are using AI-related tools, while TouchBistro’s 2026 industry report found a much higher 87% using some form of AI once broader tools (menu optimization, reservations, inventory) are counted. The gap between those two numbers usually comes down to how narrowly “AI” gets defined, not a disagreement about the trend itself.
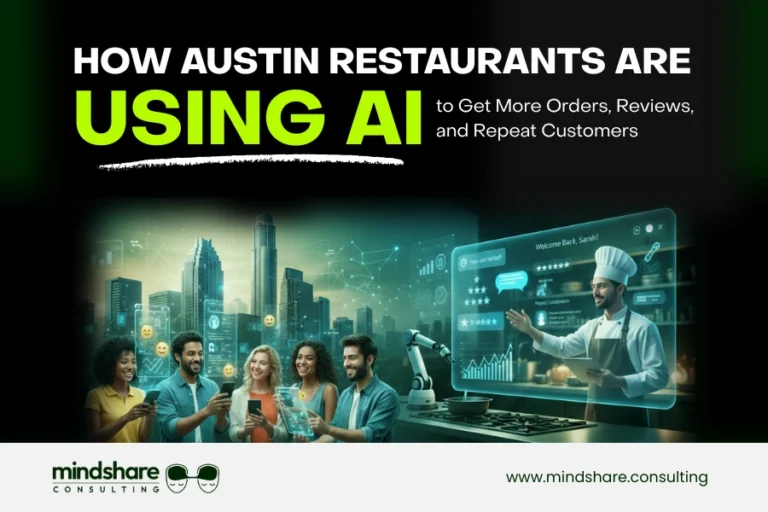
The part that matters most for a marketing-focused reader: marketing is the single largest category of AI use among operators who’ve adopted it, ahead of scheduling or inventory. Among active AI adopters, sales forecasting leads specific use cases at 53%, followed by labor forecasting at 38%. We cover this in more detail, including which AI tools are actually worth a restaurant’s time versus which ones are hype, in our guide to AI for restaurant operations in 2026 and our earlier piece on how Austin restaurants are already using AI for orders and reviews.
Operators using AI in their business report high-profit margins (above 13%) at nearly three times the rate of non-adopters. That’s not proof AI alone causes the margin, but it does mean the restaurants pulling ahead in 2026 aren’t waiting for AI to mature before adopting it.
Off-Premise, Delivery, and Online Ordering Trends
Off-premise orders (takeout, delivery, drive-thru) now account for close to 75% of all restaurant traffic. Fifty-eight percent of limited-service restaurants and 41% of full-service restaurants generate a larger share of sales from off-premise dining than they did back in 2019, and global delivery spending has grown from 9% of foodservice spending in 2019 to 22% in 2025.
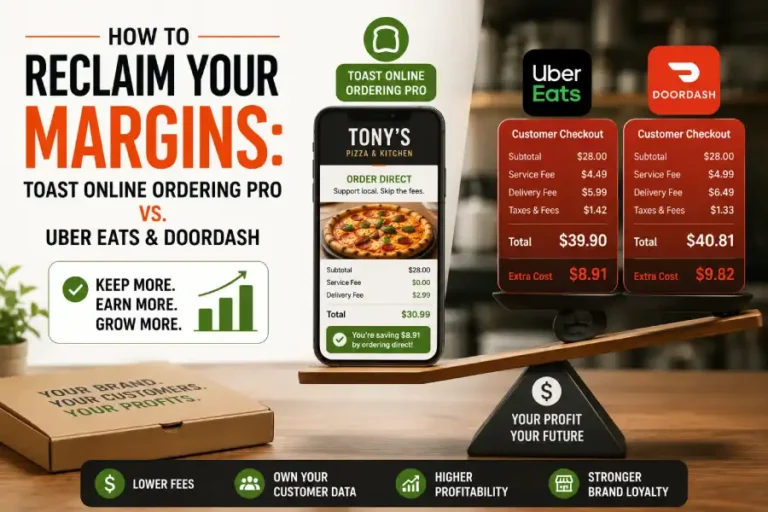
The uncomfortable half of this trend: third-party delivery platforms typically charge 15-30% in commission depending on tier, and once promotions and pay-to-play advertising fees are factored in, many operators find their real cost lands closer to 30-40% of that order’s revenue, not the advertised rate. That math is exactly why direct, restaurant-owned online ordering has become one of the highest-ROI marketing investments a restaurant can make. We go deep on the setup, menu psychology, and staff workflow behind doing this correctly in our complete guide to online ordering for restaurants, and in the specific commission-fee math behind Toast’s own ordering platform in our Toast Online Ordering optimization guide.
Restaurant Consumer Behavior Trends
More than 7 in 10 consumers say they’d use restaurants more often if they had more disposable income, according to the National Restaurant Association’s 2026 survey data. That’s a demand signal, not a demand problem: guests want to spend more with restaurants, but budget pressure is deciding for them. Restaurants that make the value case clearly (bundled specials, loyalty-tier pricing, transparent portioning) are the ones capturing that pent-up want-to-spend when a guest’s budget loosens even slightly.
This is also where retention math starts to matter more than acquisition math. A loyalty program that turns an occasional guest into a weekly regular is worth more in 2026’s flat-growth environment than a discount aimed at a first-time visitor who may not come back at all. Our Toast POS Rewards setup guide walks through building that kind of tiered, margin-aware loyalty program instead of a flat cashback discount that quietly erodes food cost percentage.
What These Trends Mean for Your Restaurant’s Marketing in 2026
- Protect frequency over chasing new traffic. With growth forecast at just 1.3%, the restaurants pulling ahead are the ones turning existing guests into repeat guests, not spending their whole budget on first-time acquisition.
- Put a value story next to every price increase. With 68% of operators raising prices due to tariffs, silence on pricing reads as a hidden squeeze. A short explanation (better ingredients, portion size, local sourcing) changes how a price increase lands.
- Treat your careers page as a marketing asset. Staffing shortages cost revenue directly through reduced hours and turned-away guests. A simple, honest “work with us” page is now part of the growth stack, not just HR.
- Move at least one AI tool from “someday” to “this quarter.” With adoption already past a quarter of the industry and concentrated in marketing use cases, waiting has a real opportunity cost, not just a hypothetical one.
- Build (or fix) your direct ordering page before adding more delivery apps. Every order that moves off a 30%+ commission platform onto your own site is closer to pure margin.
Want These Numbers Turned Into an Actual Plan?
Mindshare Consulting Inc helps restaurants translate industry trends like these into local SEO, Google Ads, Meta Ads, online ordering, and loyalty strategy built for their specific market, not a generic template.
FAQs
How big is the restaurant industry in 2026?
The National Restaurant Association projects total restaurant and foodservice sales of $1.55 trillion in 2026, with total industry employment forecast to reach 15.8 million after adding more than 100,000 jobs.
What percentage of restaurants use AI in 2026?
The National Restaurant Association’s own survey found 26% of operators using AI-related tools, while broader industry surveys that count tools like menu optimization and reservation management report adoption as high as 87%. The gap comes from how narrowly “AI” is defined.
What percentage of restaurant orders are off-premise now?
Off-premise orders (takeout, delivery, drive-thru) account for close to 75% of all restaurant traffic in 2026, and 58% of limited-service restaurants now generate a larger share of sales from off-premise dining than they did before 2019.
How much commission do delivery apps actually charge restaurants?
Advertised commission tiers typically run 15% to 30% depending on the service level chosen, but once promotions and advertising fees are included, many operators report an effective cost closer to 30-40% of that order’s revenue.
Is the restaurant industry actually growing in 2026?
Yes, but modestly. The National Restaurant Association forecasts real sales growth of 1.3% for 2026, alongside persistent cost pressure from tariffs and a majority of operators reporting softer traffic in the prior year.